After showing the growing size of turkeys raised in the U.S. over the last 32 years, we wondered how much money U.S. turkey producers were making per bird.
After all, if they're producing more meat on each bird and are therefore satisfying consumer demand for turkey meat while raising fewer birds, the increase in productivity of U.S. turkey farmers should be putting some serious cash in their pockets.
But that doesn't consider their costs of doing business. Bigger birds likely eat a lot more, which means that they cost more to raise. Our chart below shows the average farm income per turkey from 1970 through 2012, and the average feed cost per turkey for each year from 1975 through 2012:
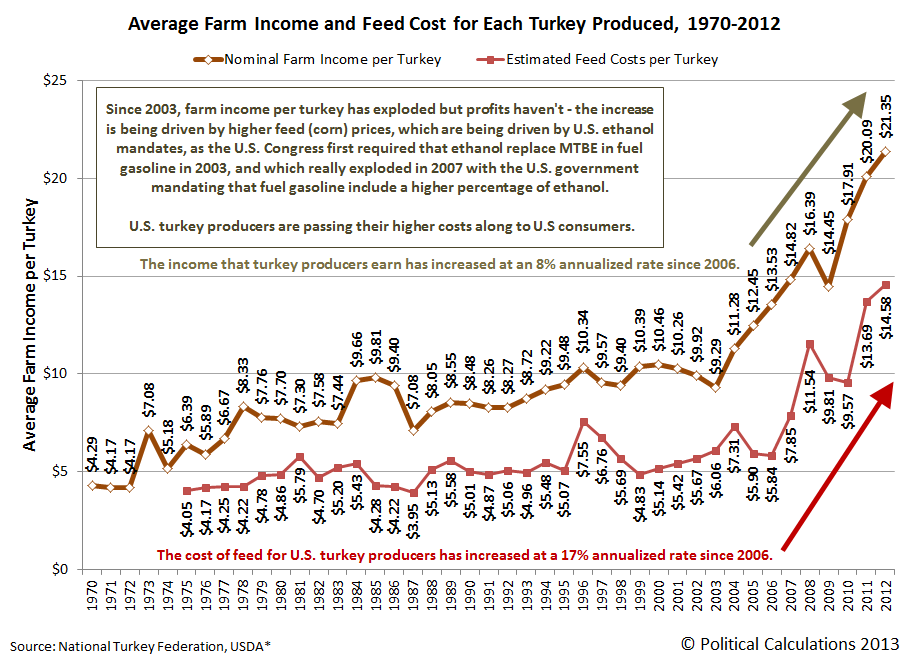
In this chart, we see that the trends in farm income per turkey and feed costs were rising fairly slowly from 1970 through 2002, but we see their income per turkey began rising rapidly beginning in 2003 and that their feed costs exploded beginning in 2007.
As it happens these are both key years for the federal government's subsidization of U.S. ethanol producers, who produce ethanol from corn, which is also the primary feed grain for farm-raised turkeys.
In 2003, the U.S. federal government acted to make ethanol the sole oxidation agent additive for fuel gasoline in the U.S. And in 2007, the federal government mandated that an increasing percentage of all fuel gasoline sold in the U.S. consist of corn-produced ethanol.
That affected the price of corn, the available supply of which was first drawn down after the government's 2003 action, which then became stuck in near shortage conditions once the 2007 mandate went into effect. The refusal the U.S. government to waive its ethanol mandate in the years since resulted in skyrocketing corn prices, which U.S. turkey farmers have been forced to pass along to their consumers in order to stay in business.
And that's why turkeys for Thanksgiving cost so much more today than what basic inflation would suggest they would, as they're getting back to the levels they cost during the stagnant '70s.

And the Number One factor driving them back to that level is the U.S. government's policies for ethanol.
Previously on Political Calculations
Labels: business, food, thanksgiving
Welcome to the blogosphere's toolchest! Here, unlike other blogs dedicated to analyzing current events, we create easy-to-use, simple tools to do the math related to them so you can get in on the action too! If you would like to learn more about these tools, or if you would like to contribute ideas to develop for this blog, please e-mail us at:
ironman at politicalcalculations
Thanks in advance!
Closing values for previous trading day.
This site is primarily powered by:
CSS Validation

RSS Site Feed
JavaScript
The tools on this site are built using JavaScript. If you would like to learn more, one of the best free resources on the web is available at W3Schools.com.
Other Cool Resources
Blog Roll


