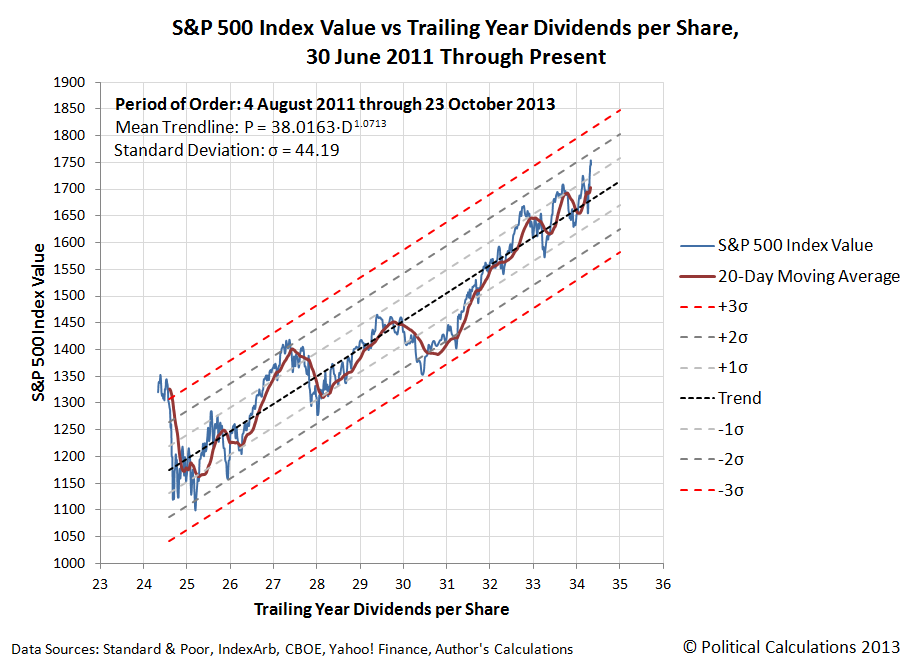
Let's look at the S&P 500's stock prices the only way they can really be understood - by showing stock prices versus their underlying dividends per share. Our first chart shows all the major trends that have existed in the stock market from December 1991 through September 2013.
Now, let's zoom in on the current trend, which happens to be a period of relative order in the stock market, which has existed since 4 August 2011 through at least 23 October 2013.
Although 4 August 2011 was a day that saw the ninth-largest point decline ever in the Dow Jones Industrial index, as the Stock Market Noise Event of 2011 was still unwinding as a result of the Federal Reserve's ending of its second quantitative easing program.
The Stock Market Noise Event of 2011 really began after Friday, 22 July 2011, exactly one month after the Fed announced that QE 2.0 would end with the second quarter of the year, concluding the Fed's massive bond-buying program that had begun back in August 2010. Coincidentally, 22 July 2011 was also the day that negotiations between President Obama and the U.S. Congress on raising the U.S. debt ceiling broke down, which happened after U.S. markets had closed for the weekend.
While that was the proximate trigger for the noise event, note that stock prices didn't recover once the 2011 debt ceiling debate was resolved on Tuesday, 2 August 2011 with the passage of the Budget Control Act of 2011, as would be expected if that had been the main driver of stock prices during the noise event. That contrasts to the situation in the U.S. stock market today, as stock prices have risen sharply in response to just the temporary resolution of the U.S. federal government's current debt ceiling crisis.
Instead, stock prices remained volatile through 22 August 2011. What was really happening was that stock prices were stabilizing at a lower level with respect to their dividends per share in the absence of any quantitative easing program operated by the U.S. Federal Reserve. Without the interest-rate lowering effect of QE, stock prices had to fall to reflect a less positive situation for future earnings growth driven by lower than previously expected economic growth, given the relationship between bond yields and stock prices, not to mention the relationship between between QE and GDP.
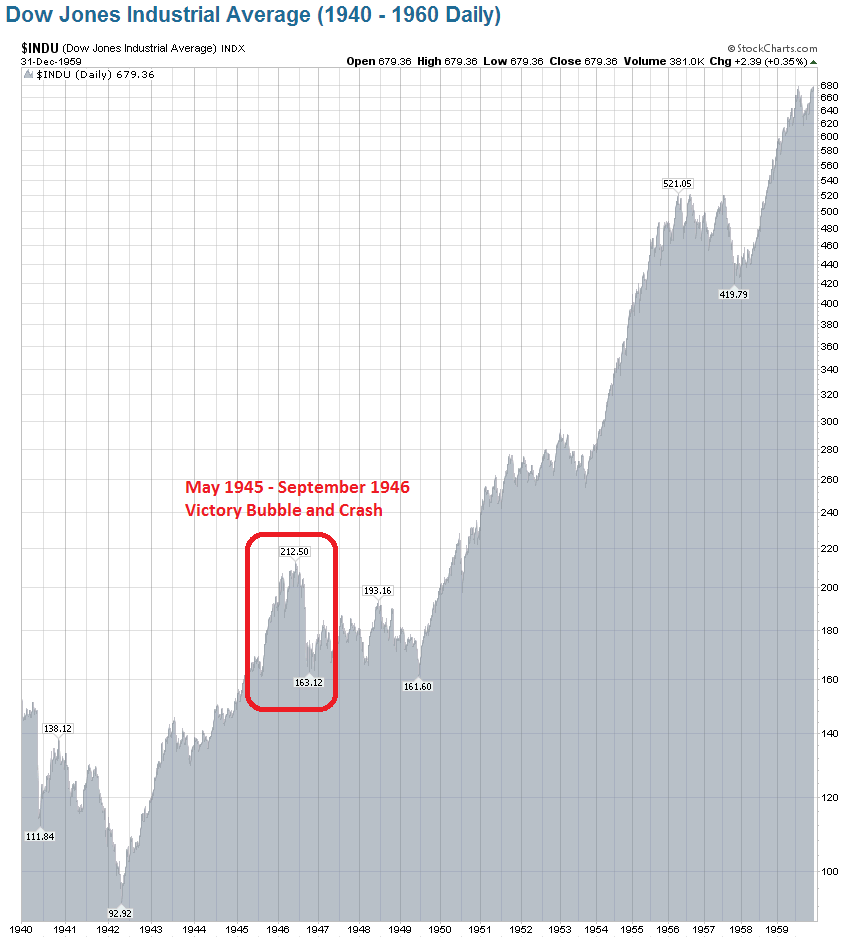
There are two parallels for the Stock Market Noise Event of 2011 in the post-World War 2 era. First, the crash of stock prices from 29 May 1946 through September 1946, which coincided with the maturation of the Victory bonds that Americans bought in the weeks following V-E Day on 8 May 1945, all the way up through V-J Day on 2 September 1945, which promoted a year-long QE-like driven surge in stock prices. Here, the bubble in stock prices lasted exactly one year since that was the minimum holding period required before the war bonds bought during this three-month long window of time could be redeemed.
The second parallel is the 1987 Black Monday stock market crash. Here, there had been a similar surge in bond buying, which set records in January 1987, complete with a coinciding surge in stock prices. Just like in August 2010 and just like in May 1945. Stock prices remained elevated for months on expectations of improved earnings, but ultimately crashed after the Federal Reserve jacked up interest rates as the forward-looking expectations that had initially supported higher stock prices changed. The result was that stock prices reset themselves by shifting down to a lower upward trajectory. Just like in 2011, and also just like in 1946.
Which is what we should expect to happen given the quantum-like properties of stock prices.
The only thing that really makes the 1987 crash stand out is how far stock prices fell in such a short period of time, which perhaps has more to do with the advent of large scale computerized trading, which occurred without the circuit breakers we have today to allow for human intervention when prices change dramatically, as these were only first meaningfully instituted in the aftermath of the 1987 Black Monday crash. By contrast, it took humans two whole days in October 1929 to create a similar magnitude shift in stock prices without the assistance of computerized technology.
Labels: dividends, quality, SP 500, stock market
Welcome to the blogosphere's toolchest! Here, unlike other blogs dedicated to analyzing current events, we create easy-to-use, simple tools to do the math related to them so you can get in on the action too! If you would like to learn more about these tools, or if you would like to contribute ideas to develop for this blog, please e-mail us at:
ironman at politicalcalculations
Thanks in advance!
Closing values for previous trading day.
This site is primarily powered by:
CSS Validation
RSS Site Feed
JavaScript
The tools on this site are built using JavaScript. If you would like to learn more, one of the best free resources on the web is available at W3Schools.com.


